Can WA achieve the National Waste Targets?

By Mike Ritchie, Director, MRA Consulting Group
The National Waste Action Plan was agreed by all Governments of Australia in 2019 (Federal, State and Local).
I have written a series of articles examining the trends and projections based on the empirical evidence provided by the State Governments in the National Waste Database.
The National Waste Action Plan Targets are Government undertakings designed to drive Australia toward a more Circular Economy.
Specifically, there are three Targets that are measurable and reportable:
- Increase Recovery Rates of all materials to 80% (currently 60%) by 2030;
- Halve the amount of Organics waste sent to landfill by 2030; and
- Reduce waste Generation by 10% per person by 2030.
In this article I am only going to deal with Target 1, the 80% recovery rate.
Q. Is WA on track to lift recovery rates from 60% to 80% by 2030? A. Yes
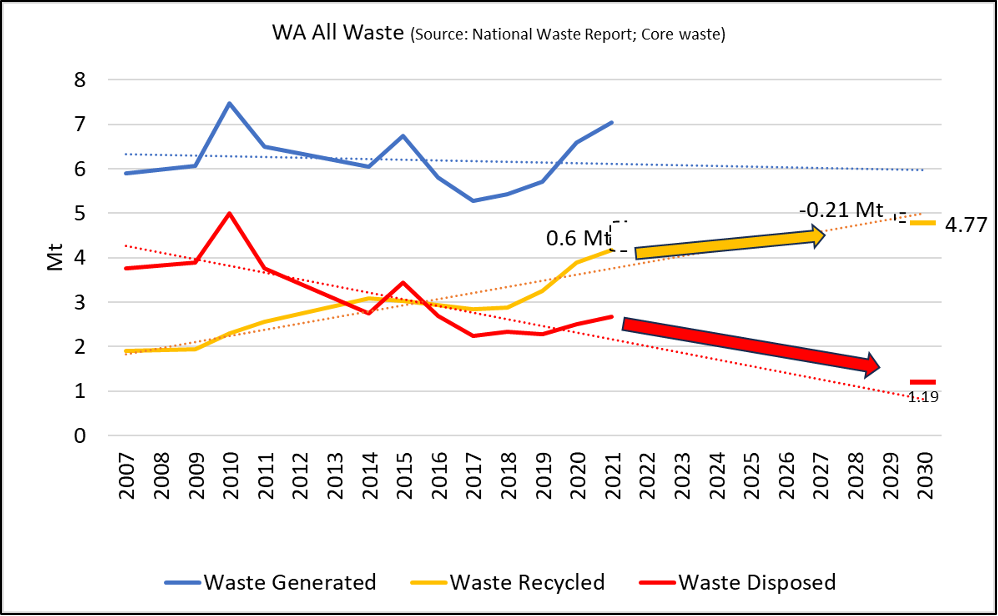
If we look at “All waste” in WA (Figure 1) we can see that the WA waste generation rate (the blue line) appears to be falling over time. That is very unusual. Given population growth, rising per capita consumption and a growing economy, it is very unusual to see total generation rates falling.
Clearly the period 2016- 2018 had a dampening effect on waste generation. That is pre-covid (Jan 2020) so that is not an explanation. I suspect it is a data issue, but I am going to accept the validity of the data until someone shows me it is incorrect. (It is surprising though. No other State has a falling waste generation rate; with valid data).
Well done WA. You are in rare company with SA in the fact that your waste generation projections look like they will achieve the National Target.
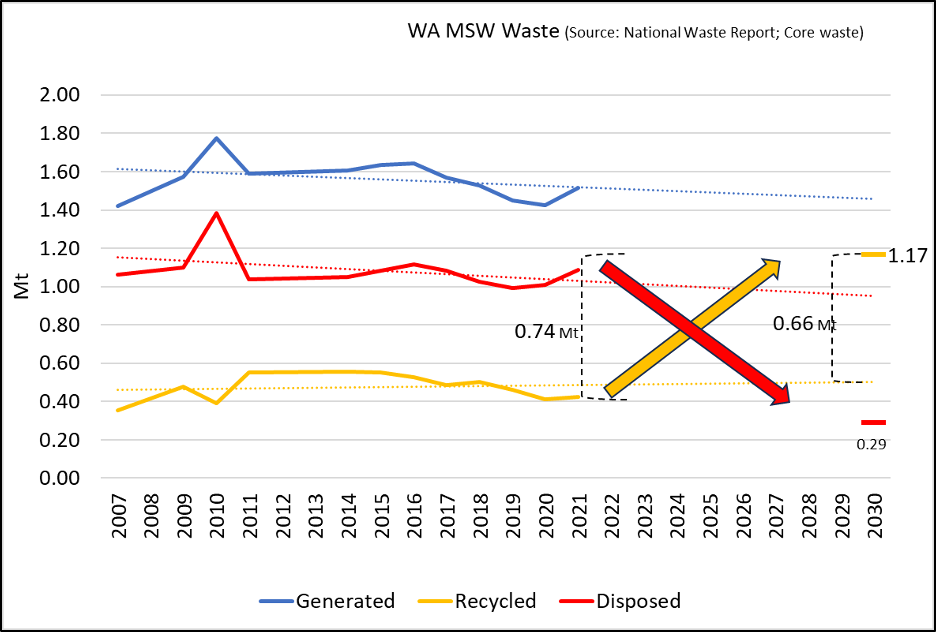
The way to interpret the graphs is:
- The blue line is waste generation (driven by population and economic growth);
- The yellow line is historic and projected recycling rates based on standard trend lines; and
- The red line is waste to landfill (again historic and projected).
- The bars are the 2030 targets.
- The dotted lines represent the historical trends for each waste stream.
- (By the way, anyone can verify these graphs by simply plotting the National Waste Data that is available at https://www.dcceew.gov.au/…/protection/waste/national-waste-reports/2022).
- How much work each sector needs to do is indicated by the slope of the arrow from where they are today to where they need to get to.
So that is a pretty good story for WA so far.
The overall recycling rate in WA is 59%.
Figure 1 shows that if recycling rates continue to grow as they have historically (let’s call it the natural growth rate of recycling; yellow dotted trend line) then it will surpass (by about 0.21 Mt), the required (projected) 2030 target of 4.7 Mt recycling required.
Similarly waste to landfill is falling fast (the red line) and also is projected to exceed the required 2030 target.
Now let’s have a look at what the data tells us about each of the major streams, household, commercial and construction.
Construction and Demolition (C&D)
The good news first.
The C+D sector in WA is going gangbusters. (The fact that Generation, the blue line, is falling is very surprising but we will go with it).
Figure 2 shows the massive growth in C+D recycling since 2007. It has grown from about 0.4MT/yr to 2.5MT/yr in the latest data. That is another 2 Mt of construction waste that has been diverted from landfill and back into the economy.
The overall recycling rate for C&D is an exceptional 83%.
So good that they look like they will over-exceed the national target by a whopping 880,000t/yr.
Well done the C&D recycling sector!!
Similarly, if they hold this trajectory, they will smash the waste to landfill target (red line Figure 2).
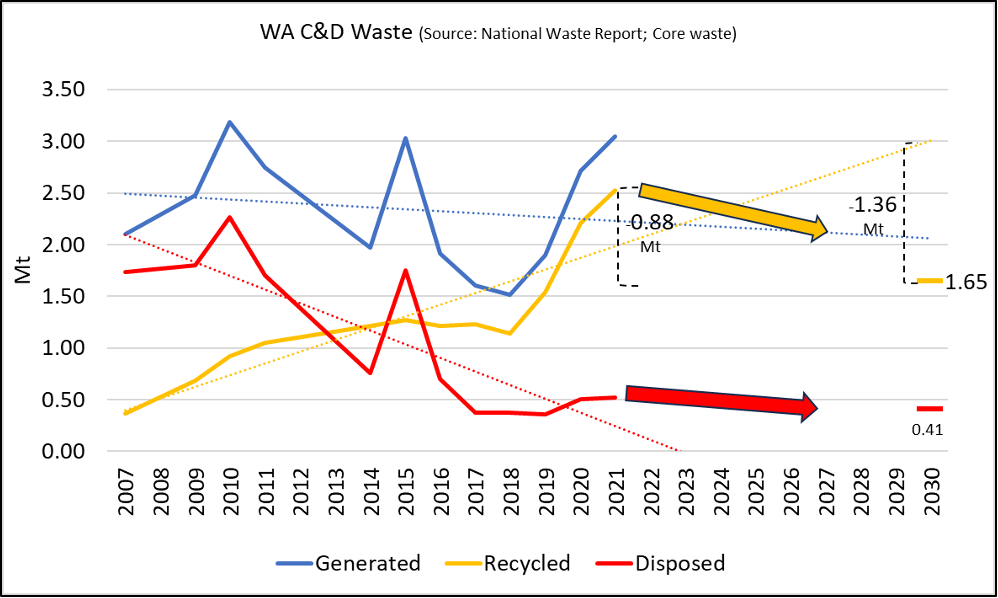
So the Construction and Demolition sector in WA is showing the other sectors what can be achieved with source segregation and the installation of sorting infrastructure.
Commercial and Industrial (C&I)
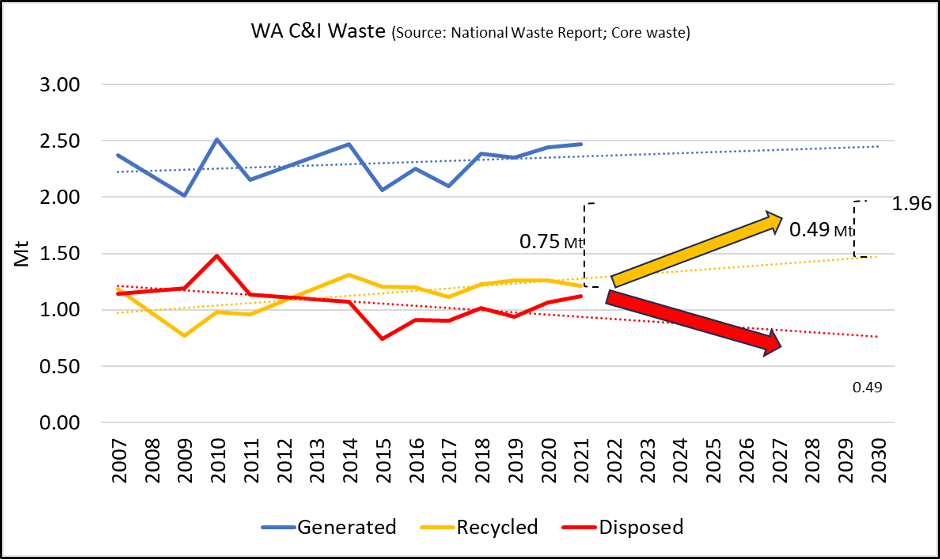
The C&I recycling (yellow line Figure 3) is growing slowly. Waste to landfill is also falling slowly. To achieve the targets WA needs to grow its recycling rate by 750,000t/yr. Good luck with that on current policies.
The overall recycling rate is 49%. It has actually fallen from 54%, 3 years ago.
There is a reason shopping centres, schools, universities, hospitals and small businesses etc send so much waste (1Mt/yr) to landfill. It is cheaper and/or more convenient to do so.
Business owners are rational. If government sends them a price signal that landfilling is cheap and easy, they will take it. It is only Government that can change the economic or policy fundamentals in this sector.
So this sector requires Government to act. It has a range of measures at its disposal including:
- Raising the landfill levy in real terms;
- Using the current landfill levy to fund additional infrastructure to sort mixed C&I;
- Mandating Food Waste be collected separately from waste (NSW will start this in 2025); and/or
- Banning non-recyclable materials.
By far the easiest is to lift the existing landfill levy and hypothecate the increase towards additional collection and sorting systems.
Household Waste
The household (Municipal Solid Waste; MSW) recycling rate (yellow line Figure 4) is limping along at basically zero growth. Waste to landfill is falling slowly.
The recycling rate is a paltry 28% and down from its peak of 33% a few years ago.
To achieve the targets WA needs to grow its household recycling rate by 740,000t/yr.
I must mention here that the National Waste data only goes up to 2021. (Why it takes so long to publish is another whole story).
The key point here though is the State Government has mandated that the Perth and Peel regions need to introduce FOGO (Food and Garden Organics) services to all households. That should see a step change in the household recycling rates.
Similarly, because of State Government policies and commitment by local governments, WA has two new Energy from Waste facilities coming on-line in 2024. While that will have a small effect on recycling rates (only additional metal will be recycled), it will have a significant effect on waste to landfill. An estimated 700,000 t/yr of household waste should be diverted from landfill. So, we may actually see the red line follow the trajectory of the arrow in Figure 4.
All good.
Summary:
- Overall WA is on track to achieve the targets
- (Only WA, TAS and SA can claim that mantle).
- C&D is smashing it.
- C&I is lagging badly and there needs to be significant policy reform to lift recycling rates.
- Households are lagging a bit but FOGO and EfW will see recycling and diversion jump rapidly.
All in all, it is a pretty good story. Well done Councils, businesses and the State Government.
Mike Ritchie is the Managing Director at MRA Consulting Group.
This article has been published by The Waste and Recycling Industry of Western Australia (WRIWA) in its Annual Report 2023: